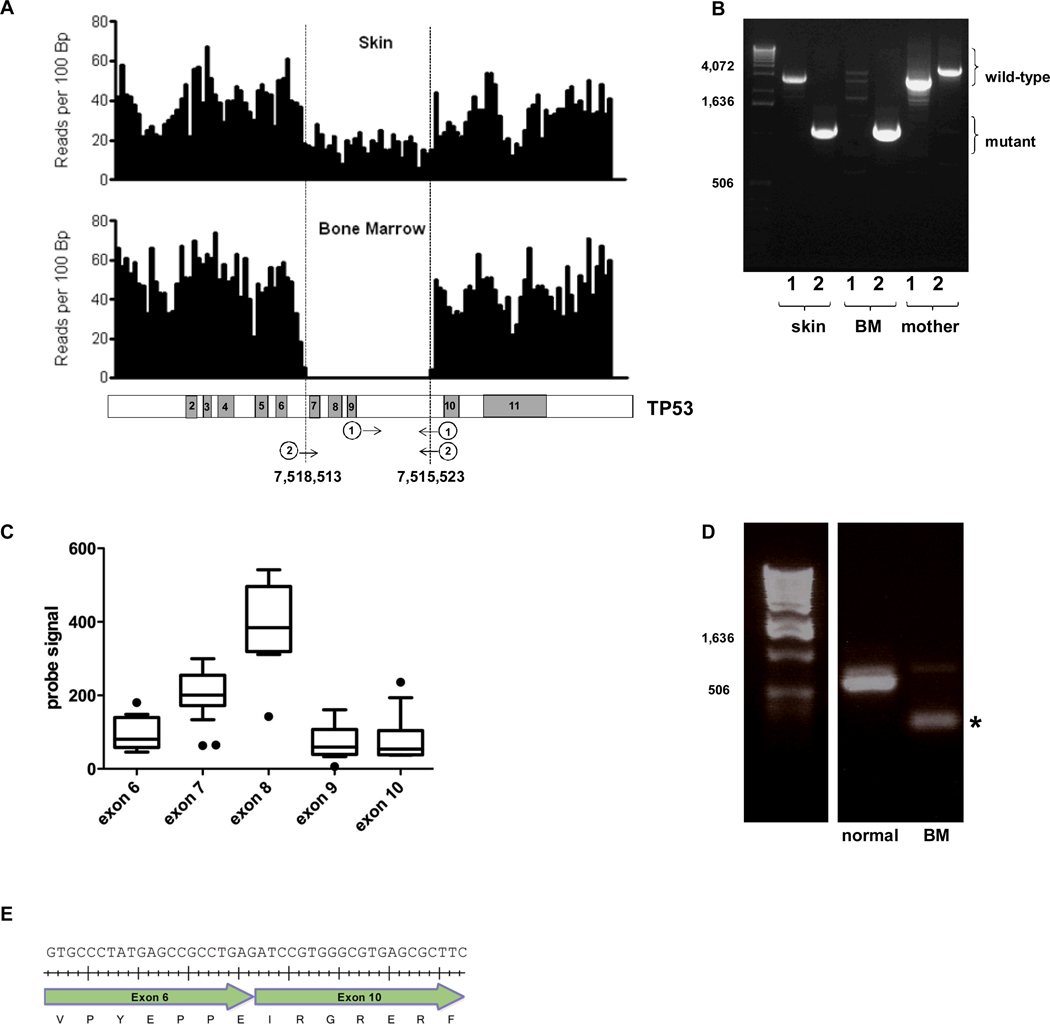
Figure 1. TP53 germline deletion.
A. Shown is the number of sequence reads per 100bp of genomic DNA that mapped to the TP53 genomic locus. Changes in sequence read depth indicate a heterozygous and homozygous deletion of TP53 in the skin and bone marrow samples, respectively (upper panel). The deletion includes exons 7-9 of TP53 (based on transcript ID ENST00000269305); genomic coordinates of the deletion boundaries are shown (lower panel). B. Genomic DNA isolated from the patient’s skin or bone marrow (BM) or maternal blood were amplified by PCR using the two primer sets depicted in Figure 1A (lower panel). The first primer set (marked “1”) produces a 2,924 bp product from the wild type but not mutant TP53 allele. The second primer set (“2”) is predicted to amplify 4,169 bp and 1,179 bp products from the wild type and mutant TP53 alleles, respectively. However, due to its smaller size, only the mutant band was consistently seen. C. TP53 RNA expression as determined by RNA expression profiling using Affymetrix Exon 1.0 arrays. The probe signal value for each exon is plotted from the t-AML patient along with the signal for 6 AML samples without TP53 mutations. Box and whisker plots for the 6 AML samples are shown; the black dots represent the t-AML sample. There are 2 probe sets for exon 7. D. RT-PCR of the patient’s bone marrow RNA was performed using primers in exons 6 and 11 of TP53. The wild type and mutant TP53 transcripts produced the predicted bands of 614 bp and 204 bp (asterisk), respectively. E. Sequencing of the mutant band demonstrated the in-frame splicing of exon 6 to exon 10 (beginning with “ATC”). Tick marks represent the placement of each nucleotide.

