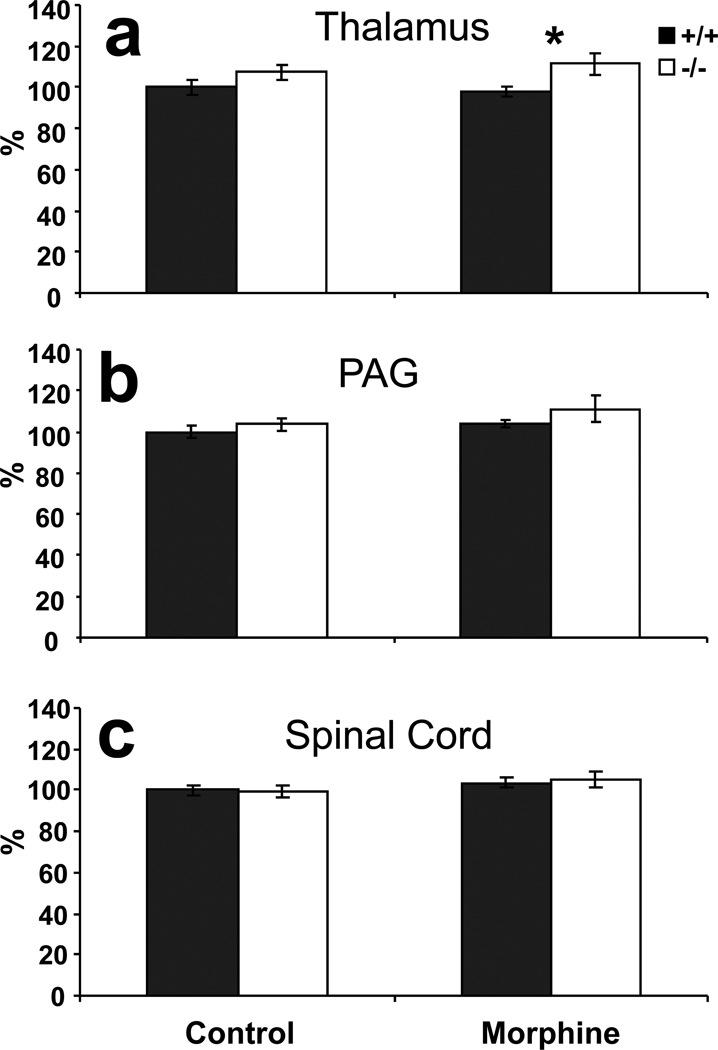
Figure 3. Phosphatase activity in control and morphine-treated KEPI mice.
Morphine-treated mice received morphine injections twice per day (16 mg/kg AM and 32 mg/kg PM) and were sacrificed on the third day, 1 hour after the AM injection. Control animals received saline injections under the same schedule. (a) Phosphatase 1 activity was significantly elevated in the thalamus of KEPI KO mice (ANOVA effect of genotype p = 0.03 after correction for multiple comparisons). (b) and (c) There were no differences in phosphatase activity in extracts from PAG or spinal cord. Data are expressed as means ± SEM (n = 9 per group).

