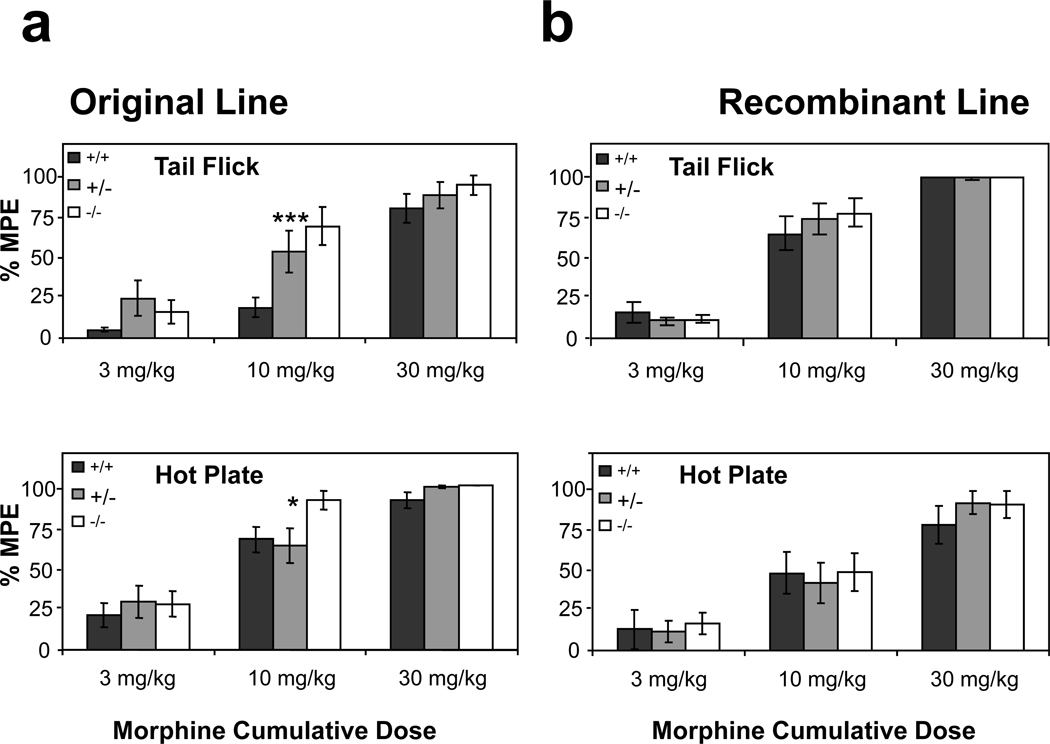
Figure 5. Morphine analgesia in two lines of KEPI KO mice.
(a) In both, tail flick (MANOVA p < 0.001 for the effect of genotype, p < 0.005 for genotype * dose interaction) and hot plate (MANOVA p < 0.05 for the effect of genotype) assays, the original KEPI KO mice were more sensitive to morphine analgesia then their WT littermates. (b) There was no significant difference between the two genotypes from the recombinant line. MPE, maximal possible effect. Data are expressed as means ± SEM (n = 12 per group).

