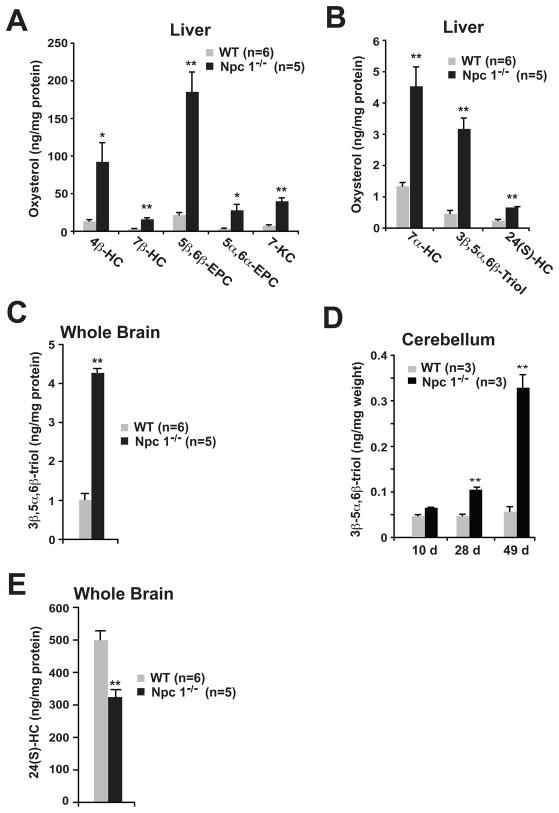
Fig. 3.
Accumulation of non-enzymatic cholesterol oxidation products in Npc1−/− mouse tissues.
(A,B) Oxysterol concentrations in livers of 9-week-old WT and Npc1−/− mice. (C) 3β,5α,6β-triol concentrations in the brain tissue of 9-week-old WT and Npc1−/− mice. (D) 3β,5α,6β-triol concentrations in cerebellar tissue of 10 day, 4-week and 7-week-old WT and Npc1−/− mice. (E) 24(S)-HC concentrations in the brain tissue of 9-week-old WT and Npc1−/− mice. Error bars represent samples from independent mice as denoted in each panel. *p<0.05 and **p<0.001 for Npc1−/− vs. WT.

