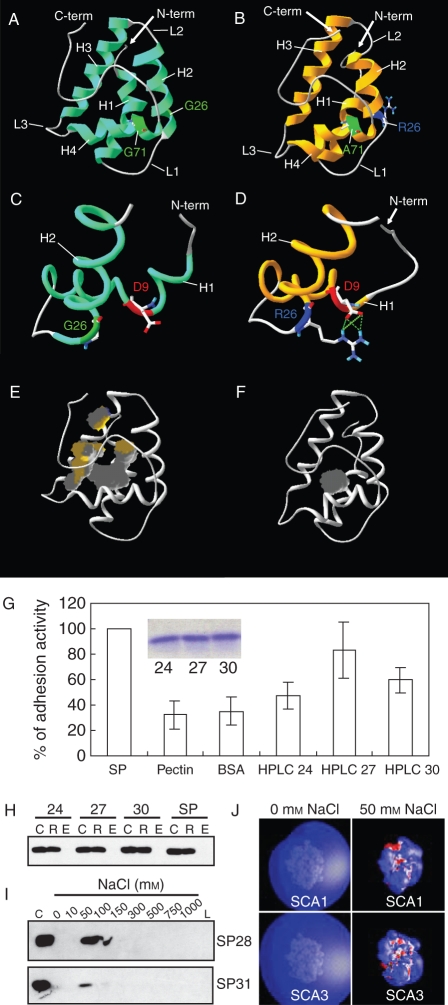
Fig. 1.
Two lily SCA isoforms that have identical pectin binding ability show different levels of pollen tube adhesion activity in vitro, with correlating structural differences. (A–F) Three-dimensional structures of SCA1 and SCA3 were generated by homology/MD modelling using the crystal structure of maize LTP (Shin et al., 1995) as the template. Both SCA1 (A) and SCA3 (B) have the typical plant LTP-like structure: a globular shape of the orthogonal four-helix bundle architecture, four disulfide bonds, an internal hydrophobic and solvent-inaccessible cavity, and a long C-terminal tail. H1–H4 indicate helices 1–4, respectively. L1–L3 represent loops 1–3. G26 in SCA1 does not interact with D9 (C). R26 in SCA3 is shown to have strong hydrogen bonding and salt bridge interactions with D9 (D). SCA1 (E) has a larger internal hydrophobic cavity (grey), compared with SCA3 (F). (G) In vitro adhesion assays using HPLC-purified SCA isoforms. SP, pectin matrix prepared with SCA-enriched size-column fractions prior to the HPLC purification as a positive control of adhesion activity; Pectin, pectin matrix alone without any protein (a negative control); BSA, pectin matrix with bovine serum albumin (BSA) replacing SCA (a negative control); HPLC 24–30, pectin matrices containing the HPLC-purified SCA proteins from size-column fractions 24 (SCA2-enriched), 27 (SCA1-enriched) and 30 (SCA3-enriched), respectively. The insert shows equal amounts of proteins (5 µg) from each fraction, applied to the bioassay. (H) In vitro pectin-binding assay. SP, positive protein control prior to HPLC purification; C, a 10 µL aliquot of protein–pectin mixtures as the loading control; R, retentate from the 100 kDa cut-off spin-column containing proteins bound to pectins; E, eluate containing proteins washed off by 1 m NaCl. (I) Ionic strengths of SCAs needed to be detached from the pectin matrix. SP28 and SP31, size-column fractions 28 (SCA1-enriched) and 31 (SCA3-enriched), respectively; C, the loading control; 0–1000 mm NaCl, eluates containing proteins that were serially washed off using a gradient of ionic strengths; L, retentate containing proteins that were left over in the spin-column after the final elution using 1 m NaCl. (J) Electrostatic potentials for homology/MD structures of SCAs. Isopotential contour plots at ±1 kBT e−1 for both SCA1 and SCA3 were generated using GRASP at 0 and 50 mm ionic strengths. Blue indicates a positive and red a negative electrostatic potential. This research was originally published in Journal of Biological Chemistry (Chae et al., 2007). Copyright the American Society for Biochemistry and Molecular Biology.

