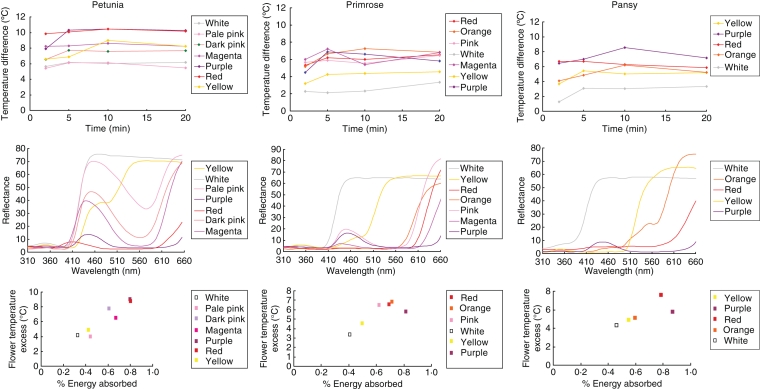
Fig. 3.
Comparison of recorded flower temperature excess (temperature difference) and reflectance data (reflectance) gathered for each colour morph of pansy (Viola × wittrockiania), petunia (Petunia grandiflora) and primrose (Primula). (A) The ‘flower temperature excess’ (the positive difference between flower temperature and air temperature) for each line of each of the three species tested. (B) The reflectance spectra for each line. (C) Estimate of energy absorbed (made by calculating the percentage reflection at each wavelength) plotted against flower temperature excess for each line. For all three species, floral temperature increased with the amount of energy absorbed (Pearson correlation coefficients: petunia, r = +0·947, t5 = 6·56, P = 0·001; primrose, r = +0·815, t4 = 2·81, P = 0·048; pansy, r =+ 0·759, t3 = 2·02, P = 0·137).

