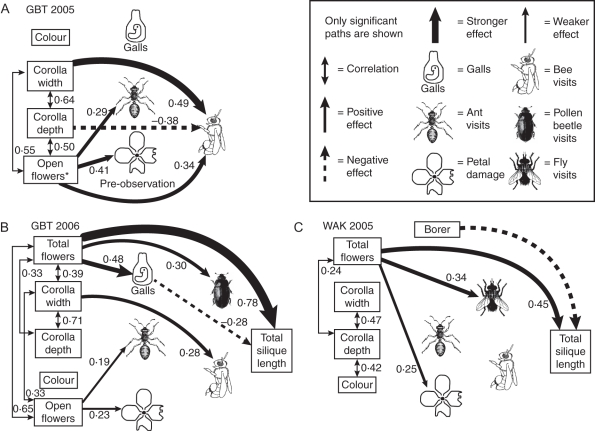
Fig. 1.
Best-fit models from structural equations analysis of GBT 2005 (A), GBT 2006 (B) and WAK 2005 (C). Numbers represent standardized path coefficients. (A) In GBT 2005, the number of open flowers (*) and petal damage were measured on the day before beginning observations. Data on galls and insect visitation were collected between 17 May and 26 May on 75 plants not included in experimental treatments. Neither total silique length nor total flowers could be measured because all plants were trampled by cattle. (B) In GBT 2006, measurements were taken for 100 plants not included in experimental treatments between 15 May and 23 May. (C) In WAK 2005 data were taken for 100 plants not included in experimental treatments between 1 June and 23 June; petal damage and open flowers were measured on 50 of these plants.

