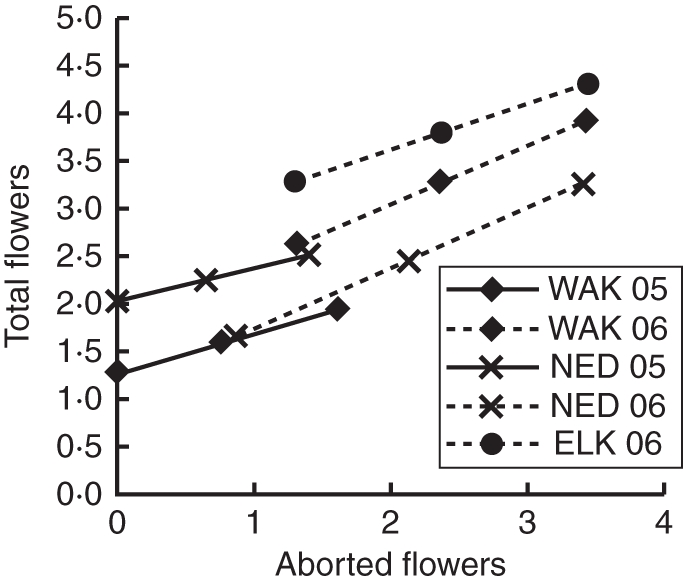
Fig. 6.

Relationship between aborted and total flowers. Total flowers increased with the number of aborted flowers in all populations and years. Lines show predicted values of total flowers for values of aborted flowers (both are square-root transformed) when accounting for other independent variables. 95 % confidence intervals of effect sizes are too small to be visible on the graph.
