
Figure 4.
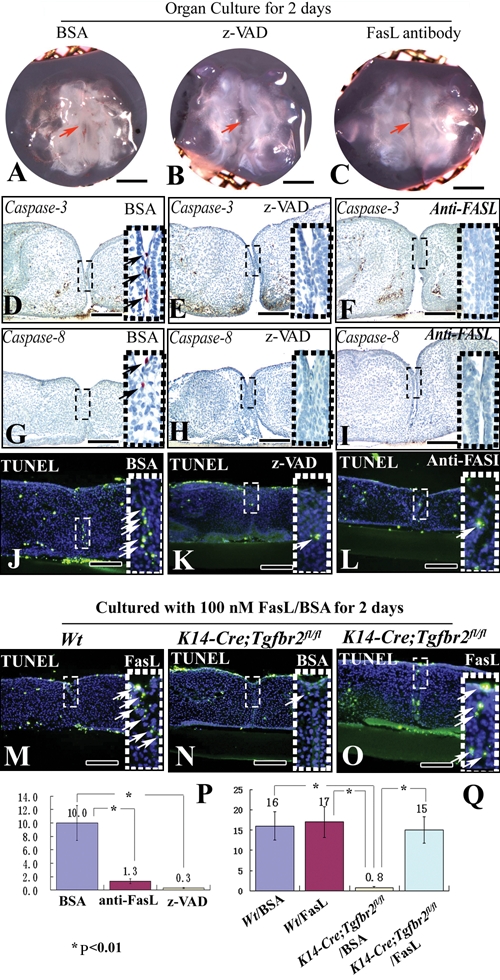
Blocking the Fas ligand-Fas-caspase pathway inhibits caspase expression. (A-C) Organ culture of E13.5 palatal shelves from wild-type mice treated with BSA (A), pan-caspase-inhibitor z-VAD (B), or blocking Fas-L antibody (C) for 2 days. Red arrows indicate fusion of the palatal shelves (A) or no fusion (B, C). (D-L, P) Immunohistochemistry of caspases 3 (D-F) and 8 (G-I) and TUNEL staining (J-L) after organ culture of E13.5 wild-type palatal shelves treated with BSA (D, G, J), pan-caspase-inhibitor z-VAD (E, H, K), or blocking Fas-L antibody (F, I, L) for 2 days. Arrows indicate positive signal. Quantitation of the number of TUNEL-positive cells in the MEE from J-L (P). (M-O, Q) TUNEL staining after organ culture of E13.5 palatal shelves from wild-type and K14-Cre;Tgfbr2 fl/fl mice treated with BSA (J, N) and FasL protein (M, O) for 2 days. Arrows indicate TUNEL-positive cells. Quantitation of the number of TUNEL-positive cells in the MEE from J, M-O (Q). Scale bars: A-C, 500 µm; D-I, 80 µm; J-L, N-P, 100 µm.