
Figure 1.
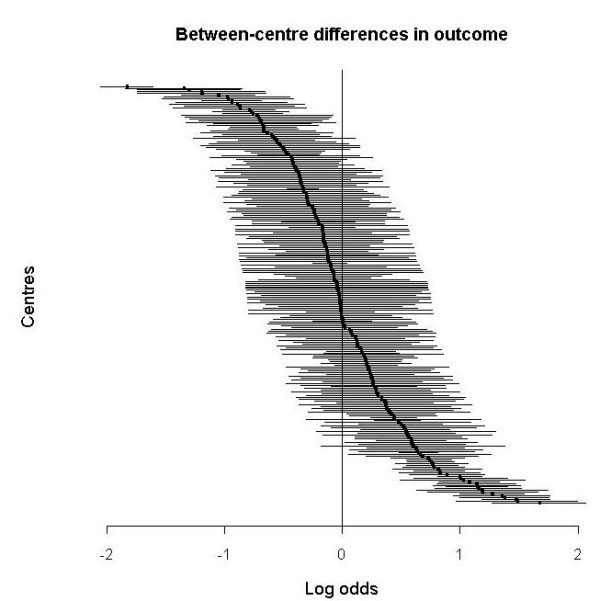
Differences between centres in mortality, adjusted for age, GCS, pupil reactivity and treatment in a random effects model. A centre with average mortality has log odds 0, a positive log odds indicates higher mortality. Lines indicate 95% posterior interval.