
Figure 3.


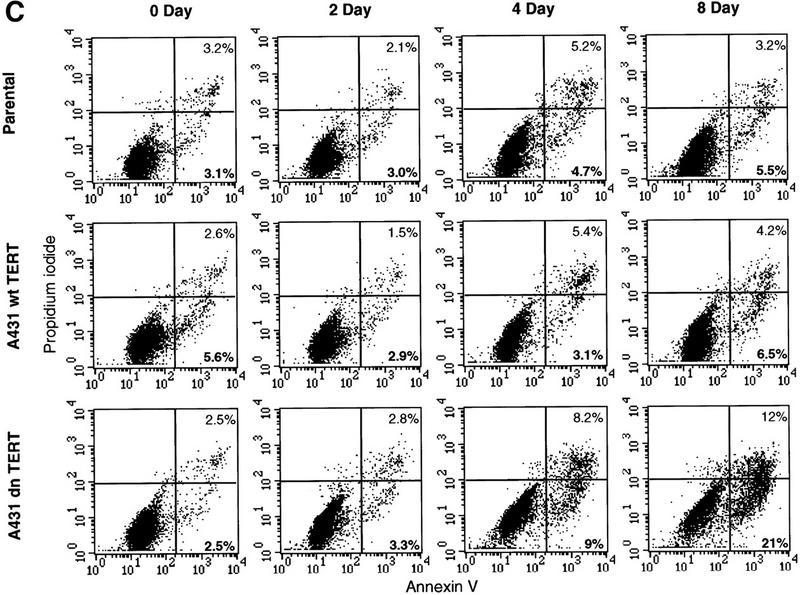

Kinetics of apoptosis induced by mutant TERT in A431 cells. Each A431 cell line (EcR, wild-type clone D2, and mutant clone B11) was plated into multiple sets of 60-mm tissue culture dishes at a density of 3 × 10⁵ cells/dish and allowed to attach overnight and recover from trypsinization. Cells were then induced by changing to medium containing 1 μm muristerone. Sets of cells from each line were used for Western blotting, apoptosis analysis, and cell cycle analysis at indicated days. (A) Kinetics of exogenous TERT expression. One set of cells per indicated day was lysed, and the total cell lysate (5 μg/lane) was run on SDS-PAGE and Western blotted with the anti-TERT peptide antibody as in Fig. 1. (Arrow) The position of hTERT. (B) Growth curve of A431 cells. Equal number of cells (1.2 × 10⁵) from each cell line were plated into six-well plates in triplicate in the presence or absence of muristerone (1 μm) and allowed to grow for 7 days with medium being changed on day 4. Cell numbers were counted each day with a hemocytometer. Data shown are mean of the triplicate from one of three experiments all showing similar results. (□) EcR (Left) Uninduced; (⋄) w.t. TERT; (●) B11. (Right) Induced; (□) ECR; (▵) w.t. TERT; (●) B11. (C) Flow cytometry analysis of cells double labeled with annexin V and PI. One set of cells from each cell line was harvested at indicated days. Cells were then stained and analyzed as described in Materials and Methods. (D) Anaphase chromosome bridges induced by mutant TERT. EcR, wild-type, and mutant A431 cells were seeded in two-well chamber slides. Cells were induced for 3 days and then fixed and stained by propidium iodide. Shown are four typical anaphase cells with bridging chromosomes in mutant A431 cells.