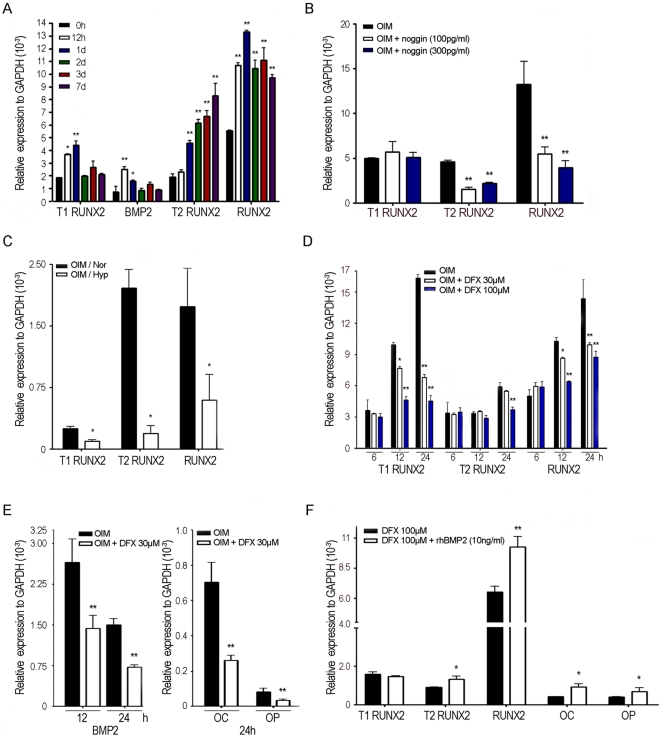
Figure 2. Expression of Type1 and Type2 RUNX2 in MSCs induced for osteogenic differentiation.
Quantitative RT-PCR for mRNA levels of indicated genes. A, MSCs were induced in OIM for indicated time period (n = 3). B, MSCs were induced in OIM without or with noggin treatment for 24 h (n = 3). C, MSCs were induced in OIM under normoxia (Nor) or hypoxia (Hyp) for 3day (n = 3). D, E, MSCs were induced in OIM or with indicated concentration of DFX for indicated time period (n = 3). F, MSCs were induced in OIM in the presence of DFX without or with rhBMP2 for 24 h (n = 3). Results are shown as the relative expression to GAPDH (mean ± SD), and significance was determined by Student's t-test. (* p<0.05 and ** p<0.01 versus black bar).

