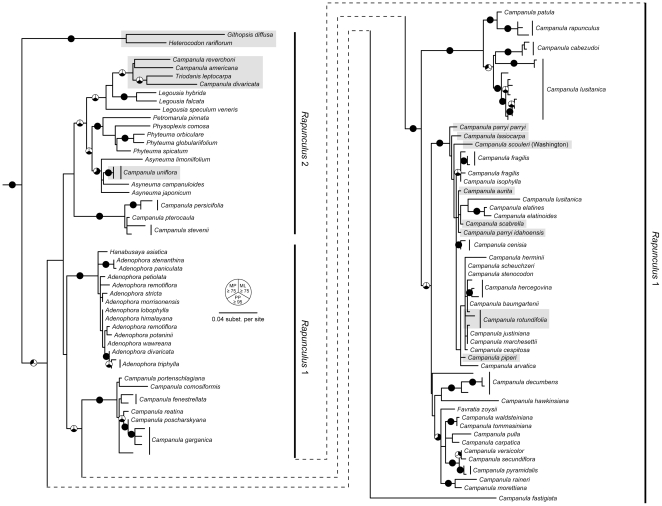
Figure 3. Best maximum likelihood phylogeny for the Campanulaceae based on ITS DNA sequences.
Outgroups have been removed for clarity. Pie graphs on branches indicate relationships that are well-supported under one or more of the three tree-building methods that we employed. Black-filled segments of the graphs indicate maximum parsimony (upper left) or maximum likelihood (upper right) bootstrap values ≥75, or Bayesian posterior probabilities ≥0.95 (bottom). Maximum parsimony bootstrap values shown here are based on analyses that incorporated data from indels using simple indel coding (Simmons and Ochoterena 2000). Gray shading denotes North American species.

