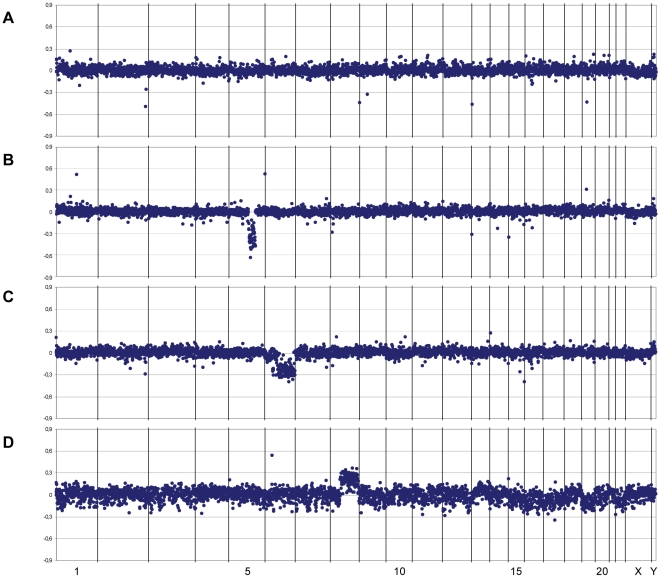
Figure 1. Examples of copy number abnormalities identified by array CGH analysis.
Graphs show the log2 ratio profiles for the BACs aligned along the X-axis from chromosome 1 to chromosome Y. (A) FAP-associated desmoid tumour HDD-I without any CNAs. (B) FAP-associated desmoid tumour HDD-H with loss of the 5q21.1-q31.1 region involving the APC gene. (C) Non-FAP-associated desmoid tumour P9A with loss at 6p21.2-p12 and 6q12-qter. (D) Non-FAP-associated desmoid tumour 114T with gain of chromosome 8q.

