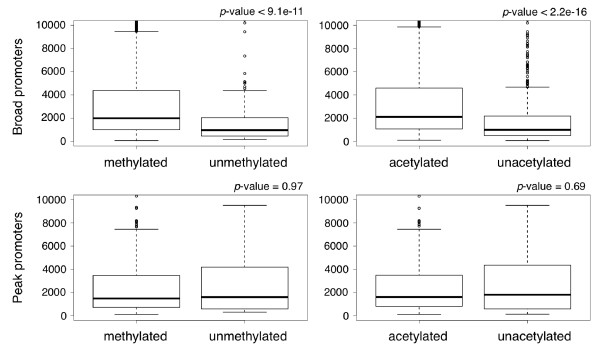
Figure 5.
Box plots of gene expression in human resting CD4+ T cells. The box plots represent the distributions of gene expression levels. Distributions of the four groups of genes are drawn separately, i.e. those with broad or peak promoters, each of which was further associated with modified histones in activated cells or with unmodified histones. The y-axis shows the microarray intensities of the gene sets in each category.

