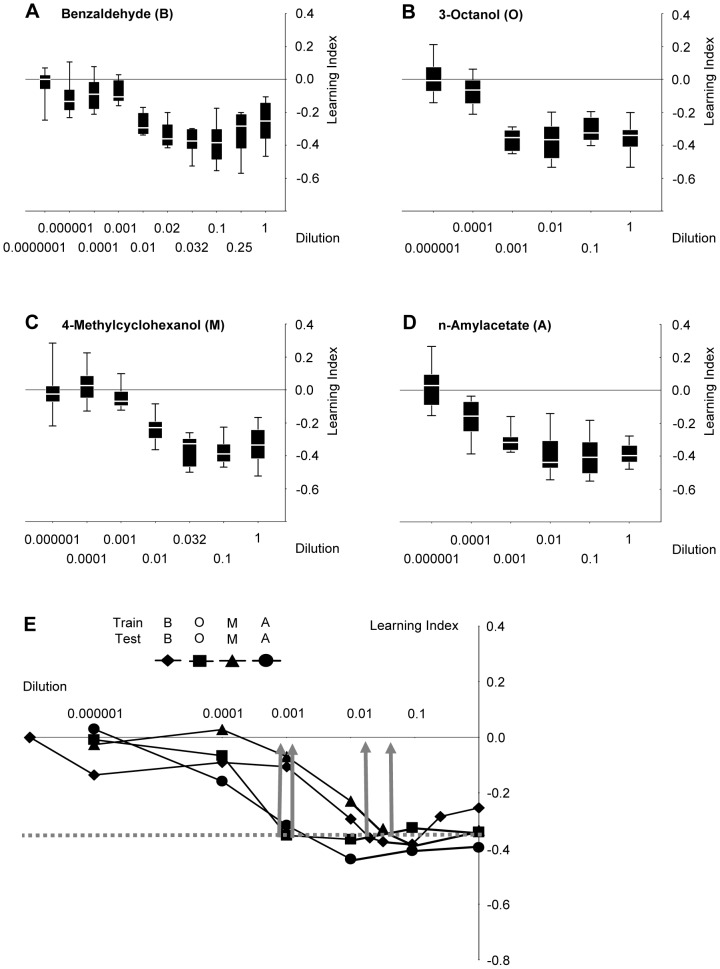
Figure 1. Adjustment of odour intensity for equal learnability.
(A, B, C, D) Flies are trained with a given odour at the indicated dilution, and then are tested using that same odour at that same dilution. Sample sizes are for B: 12, 12, 12, 12, 12, 12, 12, 8, 8, 8; for O: 11, 12, 12, 12, 8, 8; for M: 12, 8, 12, 12, 12, 8, 8; for A: 12, 12, 12, 12, 8, 8. Data are presented as box plots (middle line: median; box boundaries and whiskers: 25%/75% and 10%/90% quantiles). (E) Median data from (A, B, C, D) combined. Note that while asymptotic learning scores do not differ between dilutions, the dilutions at which that asymptote is reached differ between odours across almost two orders of magnitude. Dilutions for further experiments are chosen such that learning indices are the same and, for each kind of odour, have just about reached asymptotic levels (stippled grey line and grey arrows) (B: 1∶66; O: 1∶1000; M: 1∶25; A: 1∶1000). For sample sizes, see (A, B, C, D).

