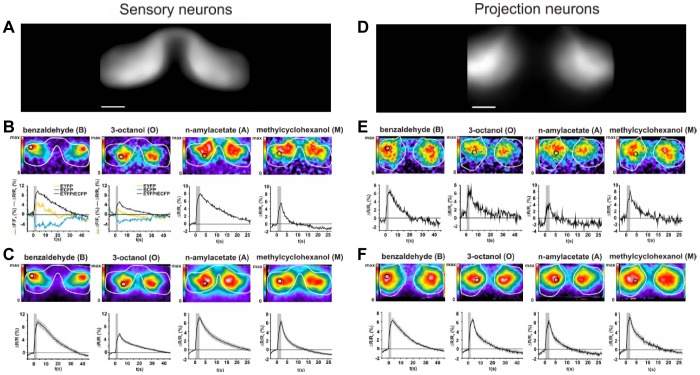
Figure 5. High signal quality and low inter-individual variability in physiology.
(A) To illustrate the shape of the antennal lobe as apparent in measurements of the sensory neurons, EYFP emission averaged across 8 individual flies is presented. Scale bar 25 µm. (B) Calcium activity recorded in the antennal lobes (white circumference-line) in sensory neurons of an individual fly after a single stimulation with the indicated odours, displayed in false-colour (top). For a defined region of interest (black circle), the time course of the measurements is displayed (bottom) as the EYFP/ECFP ratio (black). For benzaldehyde and 3-octanol as examples, also the EYFP (yellow) and ECFP (cyan) signals are plotted. The grey bar indicates the duration of the odour stimulus. (C) Calcium activity in olfactory sensory neurons averaged across 3–5 stimulations for each odour and in 8 individual animals displayed in false-colour (top). For the region of interest (black circle), the time course of calcium activity is displayed for the ration EYFP/ECFP (bottom). The grey bar indicates the duration of the odour stimulus. Data represent mean ± SEM. (D, E, F) Same as A, B, C, but for antennal lobe-measurements of projection neuron activity.

