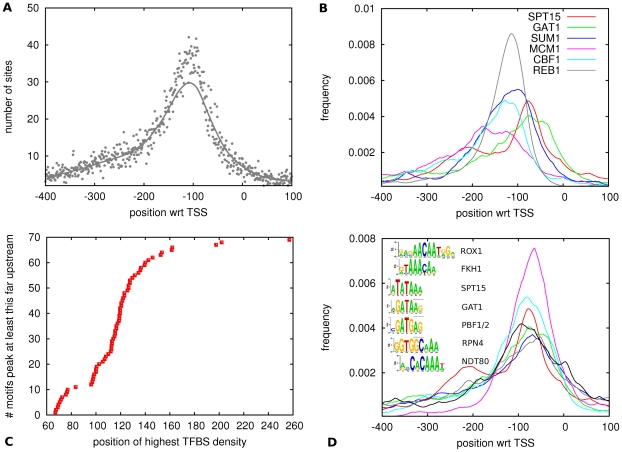
Figure 1. Distribution of predicted TFBSs relative to TSS and proximal promoter motifs.
The horizontal axes in panels A, B, and D show the location relative to TSS, where upstream positions are denoted by negative numbers. A: The vertical axis shows the total number of sites as a function of position summed over all 79 WMs and all promoter regions, with the solid line showing a smoothed version of the raw distribution (dots). B: TFBS distributions for several example TFs. The vertical axis shows smoothed frequency of site occurrence as a function of position for the TFs SPT15 (TATA binding protein), GAT1, SUM1, MCM1, CBF1, and REB1. C: Cumulative distribution of the position of highest TFBS density. Each dot corresponds to one motif. Only the  motifs with a sufficient number of predicted TFBSs were used, see Methods. D: TFBS distributions relative to TSS for the proximal promoter motifs ROX1 (gray), FKH1 (dark blue), SPT15 (red), GAT1 (green), PBF1/2 (pink), RPN4 (light blue), and NDT80 (black). The inset shows a suggested alignment of the corresponding motifs.

