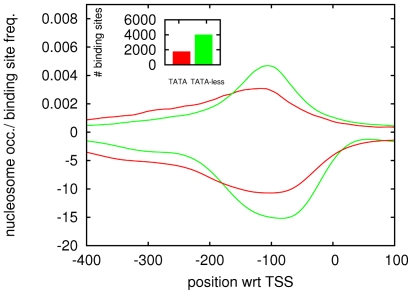
Figure 2. Positional distribution of TFBSs and nucleosomes in TATA and TATA-less promoters.
The top two lines show the positional distributions of TFBSs summed over all  motifs in TATA (red) and TATA-less promoters (green). The inset shows the total number of TFBSs in TATA and TATA-less promoters. The bottom two curves show the average nucleosome coverage (see Methods) in TATA (red) and TATA-less promoters (green).

