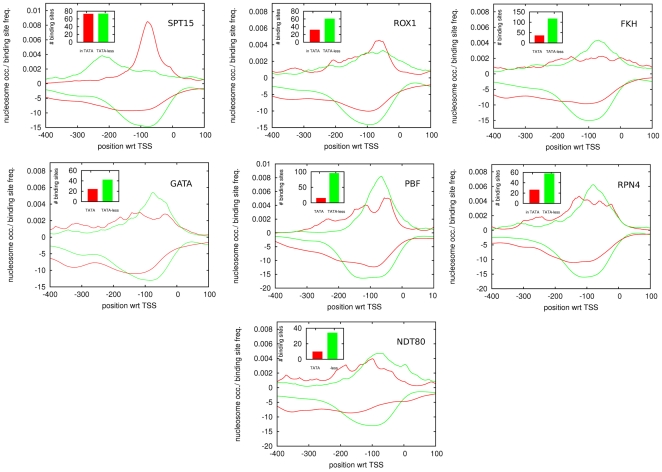
Figure 4. Positional distributions of TFBSs and nucleosome occupancy profiles for proximal promoter motifs in both TATA (red) and TATA-less (green) promoters.
Each panel corresponds to one of the proximal promoter motifs. In each panel, the position relative to TSS is indicated along the horizontal axis and the density of TFBSs (positive values) and nucleosome coverage (negative values) are shown along the vertical axis. The insets show the total number of predicted TFBSs in TATA and TATA-less promoters for the corresponding motif.

