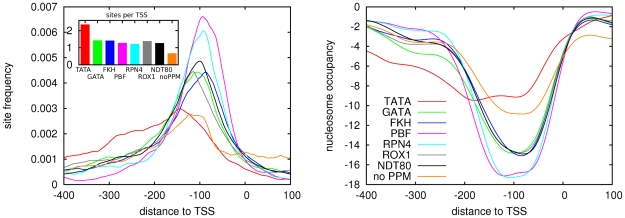
Figure 6. Positional distribution of TFBSs and nucleosomes in promoters assigned to different proximal promoter motifs.
Left panel: Overall positional distributions of TFBSs (summed over all 79 motifs) relative to TSS in the sets of promoters assigned to different PPMs. The inset shows the average number of TFBSs per promoter for each of the PPMs. Right panel: Average nucleosome coverage profiles for the sets of promoters assigned to different PPMs.

