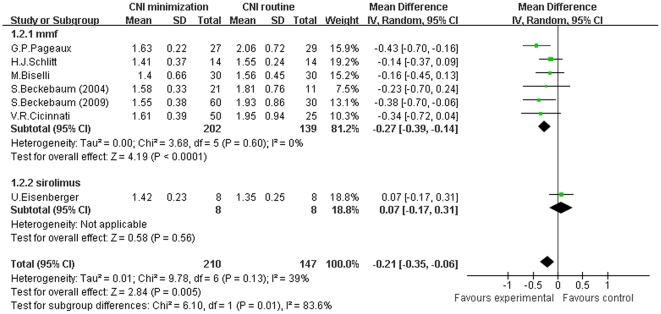
Figure 3. Meta-analysis of CNI minimization versus routine CNI regimen in sCr (RCTs).
In MMF subgroup, the sCr level was significantly lower than in routine CNI regimen group. In sirolimus subgroup, the decrease of sCr level was not statistically significant. In the total 10 RCTs, the sCr level was significantly decreased in CNI minimization group. Z = total effect size, I2 = heterogeneity index. Columns in green represent the mean difference of each study and column size represents the study weight in the analysis. Lanes represent the 95% CI of each study. Diamonds in black represent the overall effect size and diamond width represents the overall 95% CI.

