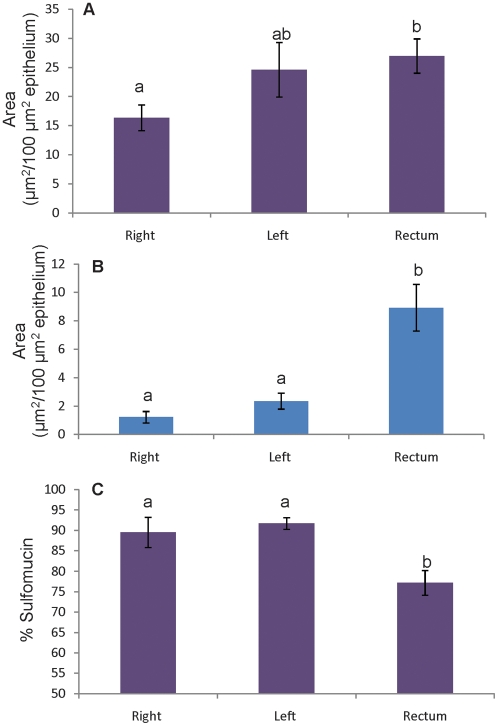
Figure 2. Area of acidomucin staining per area of epithelium in biopsies from three regions of colon.
A) Sulfomucin and B) sialomucin staining per area of epithelium and C) % sulfomucin in each colonic region. All data represent mean ± SEM (n = 20); statistically significant differences are indicated by different letters (p<0.05).

