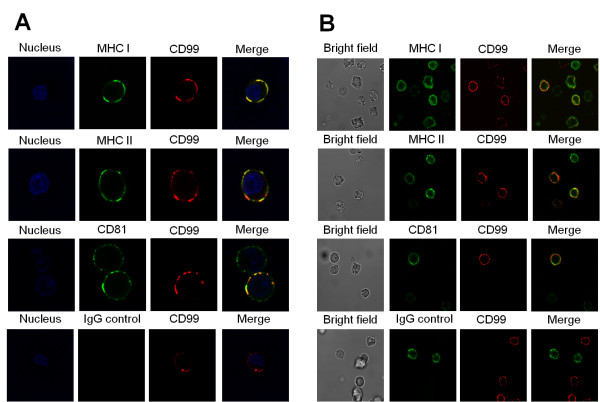
Figure 5.
Colocalization of CD99 and MHC class I, MHC class II and CD81. Raji cells (A) or PBMCs (B) were stained with anti-MHC class I (MHC I), anti-MHC class II (MHC II), anti-CD81 (CD81) and anti-CD99 (CD99) mAbs as described in Materials and Methods. In IgG control, PB1 mAb (for Raji) or MEM-111 mAb (for PBMCs) were used instead of anti-MHC or anti-CD81 mAb. The stained cells were analyzed for colocailization by a confocal microscope. The green images represent the distribution of MHC class I, MHC class II, CD81 molecules and red images represent the CD99 molecules. Cell nuclei are shown in blue.

