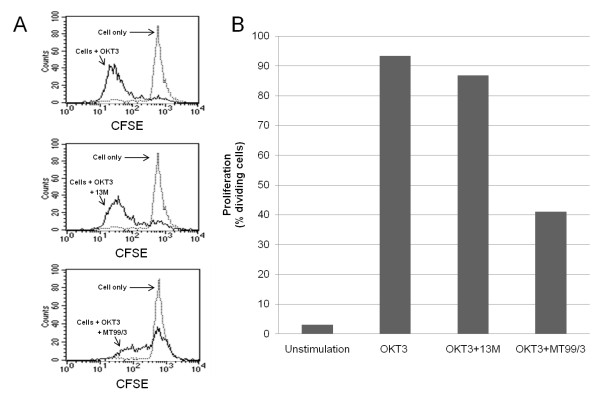
Figure 9.
Engagement of CD99 inhibits T cell proliferation. PBMCs were labeled with CFSE and cultured with or without anti-CD3 mAb OKT3 in the absence or presence of anti-CD99 mAb MT99/3 or isotype matched control mAb 13 M for 5 days. Cells were then harvested and acquired in a flow cytometer. (A) FACS profiles illustrate the T-cell proliferation levels obtained in the different indicated conditions, as determined by CFSE fluorescence loss. (B) Histogram plots show the level of cell proliferation as determined by the percentage of dividing cells in the indicated culture conditions.

