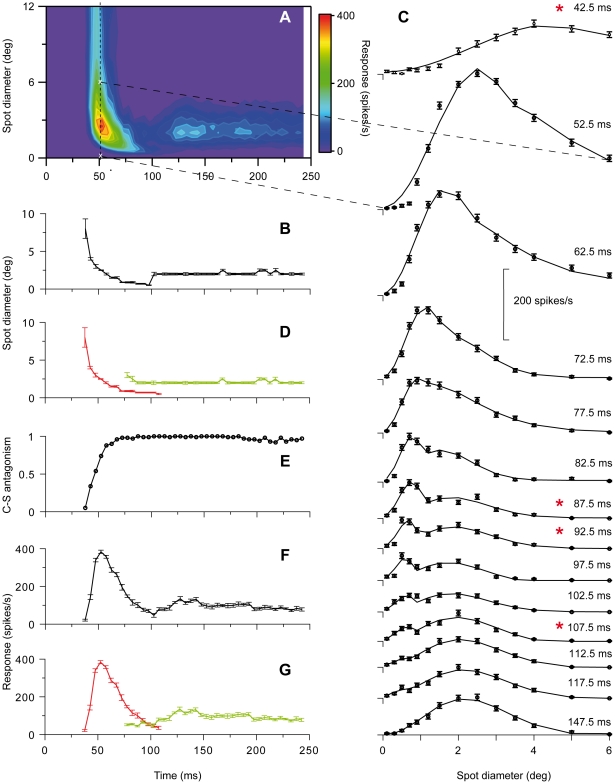
Figure 1. RF dynamically changes during brief stimulus presentation.
Data from an on-center Y-neuron. A, Colormap image of response (z-axis) to a series of spots (n = 25) of different diameters (y-axis) at different time after spot onset (x-axis). Spots were centered on the RF. B, Center-width as function of time after spot onset. Center-width was determined by spot diameter giving maximal response. The RF-center shrank from initially 8 deg to a minimum of 0.5 deg and then increased to a stable width of 2 deg at ∼100 ms. C: Spot width tuning curves for a selected number of time-slices. Notice the truncated x-axis. The time-slice for the spatial summation curve at 52.5 ms is marked by the vertical dashed line in (A), and the first and last data point in this curve are marked by white crosses in (A). Notice the shoulder or bimodal appearance of the curves in the range of 72.5 and 107.5 ms. Single (Eq. 4) and double (Eq. 5) DOG-functions were fitted to the data. Continuous curves show the best-fitting 2-DOG function (linearly interpolated between the spot sizes corresponding to experimental data points). Cases in which the 2-DOG gave statistically better fit than the best-fitting single DOG are marked with asterisk. D, Replot of data in (B) where center width of the transient (red curve) and sustained component (green curve) are separated based on the estimated start of the sustained component, and the end of the first component. E, Development of center-surround antagonism. Notice that 100% antagonism was reached within the first 70 ms. F, Development of the firing rate to the spot that just filled the RF-center. G, Data from (F) separated for the transient (red) and sustained (green) components. Error bars are ±SE. Number of presentations of each spot, 200.

