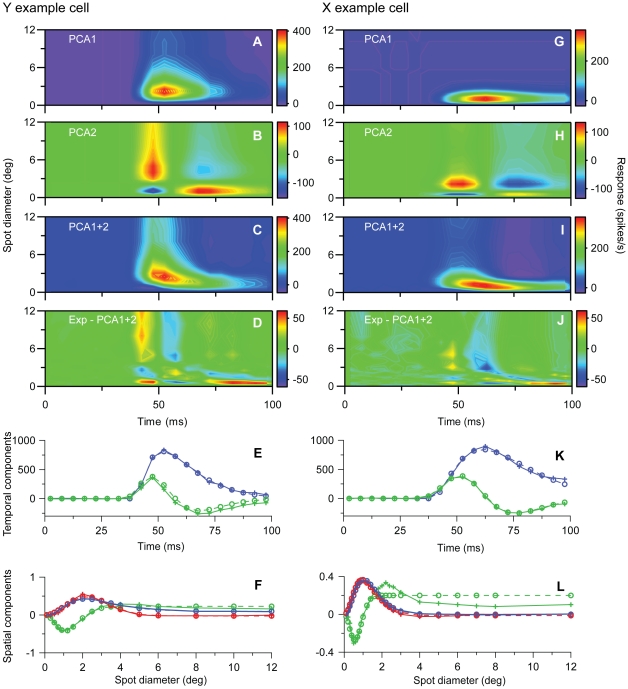
Figure 9. Principal components analysis (PCA) of early part of response data (t<100 ms) for example on-center Y and X neurons in Figs. 1 and 2 .
A,B, 1st and 2nd principal components, respectively, for the Y-neuron response data, i.e., contributions from terms with n = 1 and n = 2 in Eq. (3). C, Sum of contributions from two first principal components (and background activity) for Y neuron. D, Deviation between experimental results for Y neuron and PCA results in (C). Error ε (cf. Eq. 1) is 0.044. E, Fitted transient temporal function Ft1(t) (Eq. 11, blue dashed line) to 1st temporal PCA component (blue solid line), and fitted transient temporal function Ft2(t) (Eq. 12, green dashed line) to 2nd temporal PCA component (green solid line) for early part ( t<97.5 ms) of Y-neuron data. F, Blue dashed line: Fitted DOG spatial functions (Eq. 10) to 1st spatial PCA component of early part (t<97.5 ms) of Y-neuron data (blue solid line). Green dashed line: Corresponding DOG function fit to the 2nd spatial PCA component (green solid line). The best fit of a DOG function (red dashed line) to the 1st spatial PCA component of the last part of the Y-neuron data is also shown (red line). G–L, Same as (A)–(F) for X-neuron response data. The deviation between experimental results and PCA results (I) corresponds to an error ε = 0.021.

