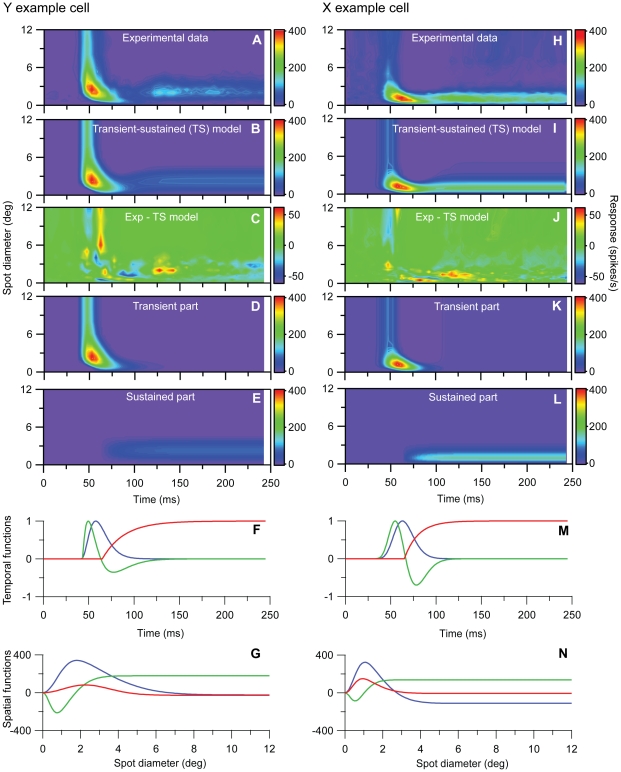
Figure 10. Fits to transient-sustained (TS) model for example on-center Y and X neurons in Figs. 1 and 2 .
A, Experimental Y-neuron response data. B, Best fit to TS model in Eq. (14). C, Deviation between experimental results (A) and model results in (B). Error ε (cf. Eq. 1) is 0.029. D, Transient component only, i.e., R(t,d) = [Rbkg+Ft1(t)Gt1(d)+Ft2(t)Gt2(d))]+. E, Sustained component only, i.e., R(t,d) = [Rbkg+Fs(t)Gs(d)]+. F, Fitted transient temporal functions Ft1(t) (Eq. 11,blue line) and Ft2(t) (Eq. 12, green line), and sustained temporal function Fs(t) (Eq. 13, red line) for Y-neuron. G, Fitted transient spatial functions Gt1(d) (blue line) and Gt2(d) (green line), and sustained spatial function Gs(d) (red line) for Y-neuron. All spatial functions are modeled as DOGs, cf. Eq. (10). H–N, Same as (A)–(G) for the X-neuron response data. The deviation between experimental results (H) and model results (I) corresponds to an error ε = 0.022. The fitted parameter values from both fits are listed in Table 1.

