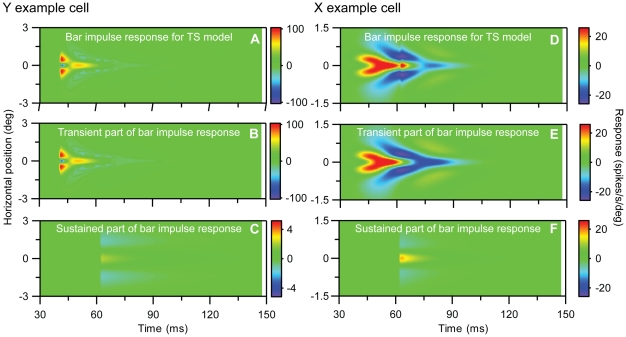
Figure 12. Predicted ‘one-dimensional impulse response’, i.e., impulse response for long and thin bars, for the transient-sustained (TS) model for example on-center Y and X neurons in Figs. 1 and 2 .
This impulse-response function of the form given in Eq. (16), but with the spatial functions gm(r) replaced by the function gbar,m(x) listed in Eq. (21). The test bar in the example has a length L = 10 deg. All model parameters correspond to the fit depicted in Fig. 10 and are listed in Table 1. A. Predicted receptive-field function for full TS-model for Y neuron. B. Contribution from transient part (ft1(t) gbar,t1(x)+ft2(t) gbar,t2(x)). C. Contribution from sustained part (fs(t) gbar,s(x)). D–F. Same as (A)–(C) for the X-neuron. Notice that (i) the color scale in C and F differ from the scale in the other corresponding color maps and (ii) that the negative response for the Y-neuron has been truncated at the numerical value −100 spikes/s/deg in panels A and B.

