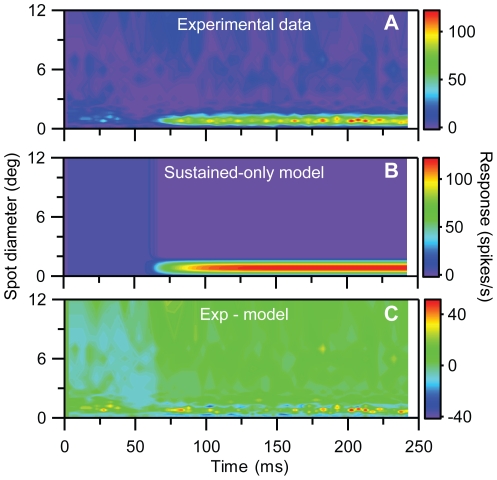
Figure 13. Fit of sustained-only model to the response data of the lagged cell in Fig. 4 .
A, Experimental data. B, Best fit to sustained-only model in Eq. (15). C, Deviation between experimental results (A) and model results in (B). Error ε (cf. Eq. 1) is 0.086.

