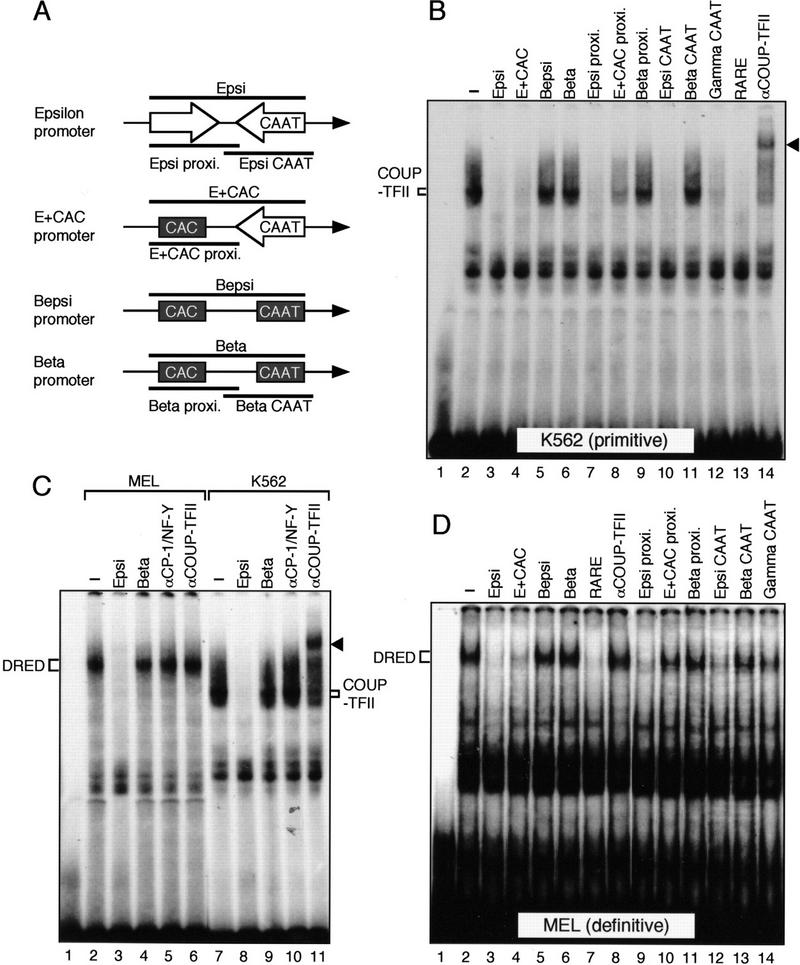
Figure 8.
Analysis of nuclear factor binding to the ɛ-globin gene promoter. (A) Schematic representation of the promoter region of the ɛ, E + CAC, Bepsi, and β genes, and fragments used as competitors in the EMSA experiments (thick lines). Positions of proximal CAC (black box) as well as ɛ (in an open arrow) or β (black box) CAAT boxes are shown. Putative binding sites for both COUP–TFII and DRED are indicated by the open arrow (each arrow represents a direct repeat sequence). (B) EMSA with K562 cell extracts and a probe containing proximal sequences and CAAT box of the ɛ-globin promoter (Epsi in A). A 200-fold molar excess of unlabeled DNA was used as competitor unless otherwise stated. The shifted band generated after including an antibody recognizing COUP–TFII is indicated with an arrowhead (lane 14). (C) Comparison of proteins from MEL and K562 cells that interact with the Epsi fragment. A comparable amount of protein extract was used for analysis. A 200-fold molar excess of competitor DNA or antibodies were used to test binding specificity. The supershifted COUP–TFII/antibody complex is detectable only in K562 cells and indicated by an arrowhead. (D) An EMSA similar to that shown in B was performed with MEL cell extract.

