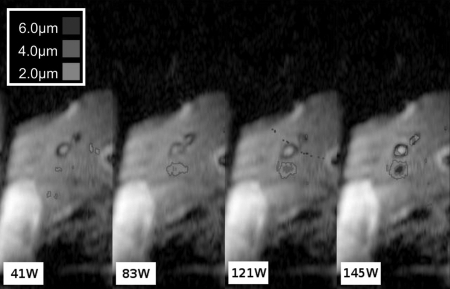
Figure 3.
Displacement images at various applied transducer powers. These images are a subset of the power to displacement curve presented in Fig. 4. These measurements were recorded at the same focus location throughout one breath-hold. The units are acoustic watts for the applied power. As the power increases, the displacement at the focus also increases.

