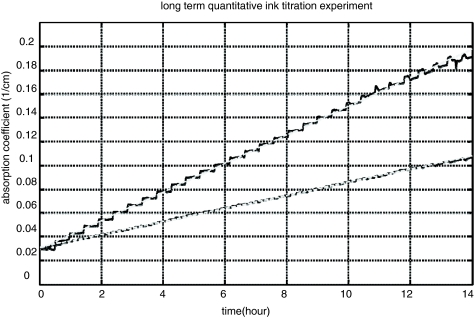
Figure 4.
Results from two long term ink titration phantom tests to demonstrate the stability and quantitative accuracy of NINscan. The top curve is from an India ink titration test (at constant titration speed) simulating dark tissue types and the bottom curve is from a phantom test simulating light tissue types. The black solid lines are the absorption coefficients calculated from NINscan measurements, and the gray dashed lines are their linear fitting results. The steps in the curve show the falling of the ink droplets into the intralipid solution, which was continuously mixed to maintain a homogeneous phantom.

