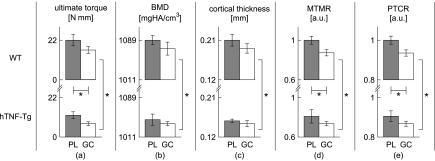
Figure 2.
Bar plots of the mean (a) ultimate torque, (b) BMD, (c) cortical thickness, (d) MTMR, and (e) PTCR of each group. The error bars are plotted as the standard error of the mean. The gray bars represent PL-treated groups and the white bars represent GC-treated groups. *p≤0.05 as determined by two-way ANOVA.

