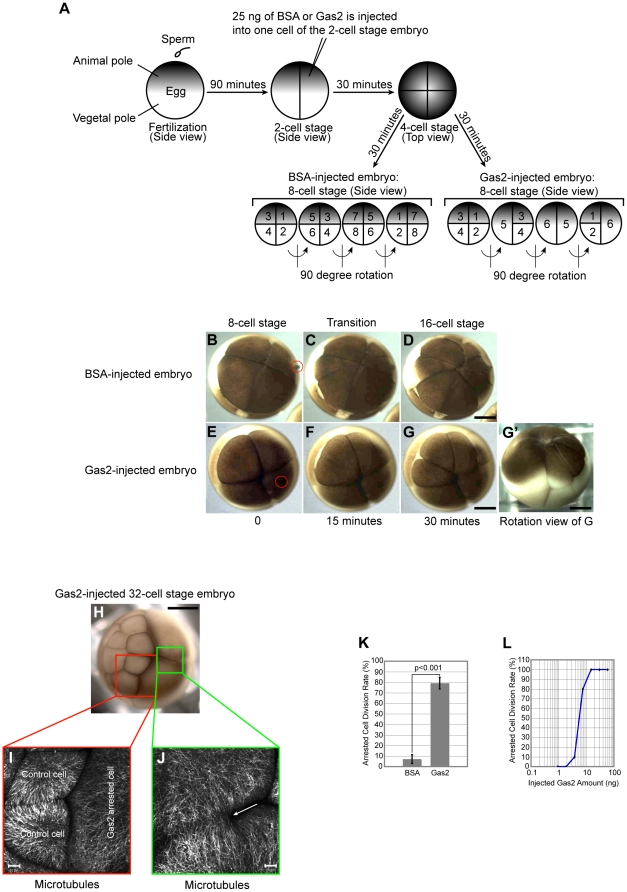
Figure 2. Exogenous Gas2 inhibits cell division in Xenopus embryos.
(A) The experimental flowchart and schematically represented results. The darker side of the egg represents the animal pole and the lighter bottom side represents the vegetal pole. The 90 degree angle rotation views show cell numbers in BSA-injected control vs. Gas2-injected embryos. (B–D) BSA-injected Xenopus embryos continue through normal cell divisions (Video S1). (E–G) Gas2-injected embryo cells divide once, then arrest in subsequent cell divisions. The non-injected control cell of the Gas2-injected embryo divides normally, and the cell number increases 2-fold every 30 minutes at room temperature (Video S2). The red circles in B and E indicate the needle injection sites. Time was set to 0 at 8-cell stage for demonstration purposes. (G') The rotation view of Fig. 2G embryo shows one of the large arrested cells on the left. Bars, 0.3 mm. (H) Stereo microscopy examination of a Gas2-injected embryo at the 32-cell stage. The normal dividing cells are on the left and the two large arrested cells are on the right. Bar, 0.3 mm. (I and J) Confocal microscopy analysis of post-injected embryo cells with tubulin antibody staining. The white arrow in J indicates that the two large, arrested cells remain connected with microtubules. Bars, 20 µm. (K) Statistical analysis of cell division rate in BSA- and Gas2-injected embryos. Only 7.2±4.2% of BSA-injected embryos arrest in cell division; however, 79.2±5.5% of Gas2-injected embryos arrest in cell division (n = 300 embryos and from 5 experiments, p<0.001). (L) Dosage dependent analysis of cell division rate in Gas2-injected embryos. The calculated LD50 from the dosage dependent analysis graph is 5.5 ng or 31 µM for one cell of the 2-cell stage Xenopus embryo. The x-axis of the graph is in logarithmic scale.

