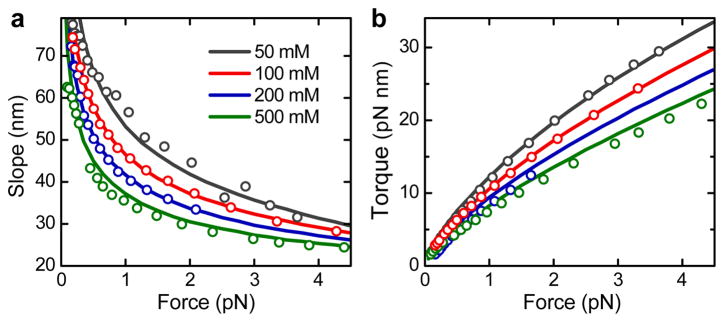
Figure 2.
Comparison of the predictions from the theoretical model with data from ref. 13. (a) Slopes after buckling versus force for different Na+ concentrations. Circles represent experimental data, solid lines the theoretical prediction for χCR = 0.42. (b) Torque after buckling. Colors and symbols are as in a.

