Figure 3.
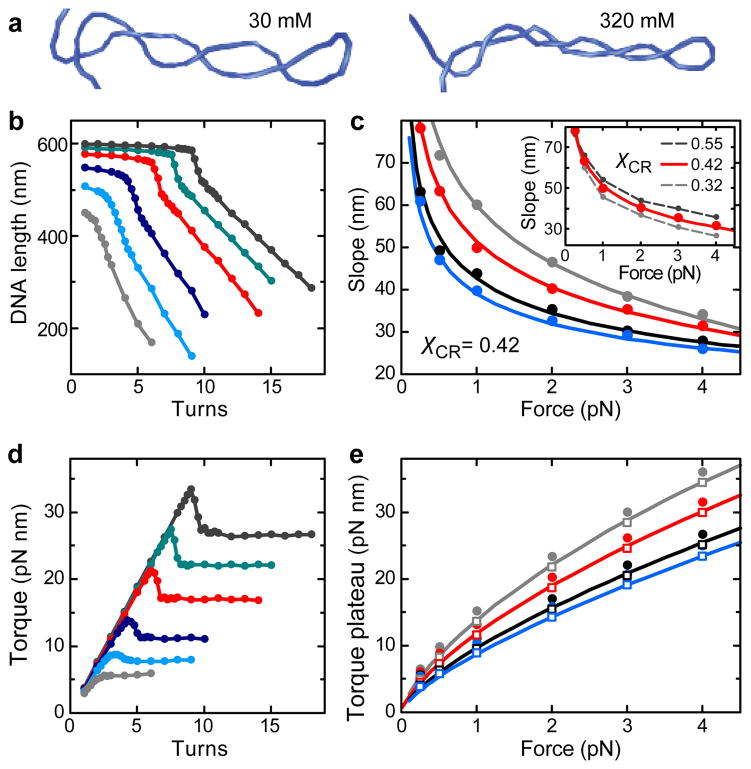
Coarse-grained Monte-Carlo simulations of DNA supercoiling. (a) Snapshots of the formed plectoneme at 1 pN and 8 turns in the presence of 30 and 320 mM monovalent ions. The linear, stretched parts of the DNA as well as the surface and the bead are not shown. (b) Simulated DNA supercoiling curves for 170 mM Na+ at stretching forces of 0.25, 0.5, 1.0, 2.0, 3.0 and 4.0 pN for χCR = 0.42 (colors are as in Figure 1b). Simulated curves excellently reproduce the experimentally observed behavior. This includes the abrupt force- and salt-dependent buckling at the onset of the plectonemic phase, which is accompanied by a torque overshoot (see d). Buckling is followed by a linear DNA length decrease with added turns at constant torque. (c) Slopes after buckling obtained from the simulated curves for Na+ concentrations of 30, 60, 170 and 320 mM (circles, colors as in Figure 1b) and corresponding predictions from the theoretical model for χCR of 0.42 (solid lines). Inset: Slopes from simulated curves at 60 mM Na+ for χCR = 0.42 (red dots) as well as for χCR = 0.32 and χCR = 0.55 (gray dots with dashed lines). The prediction for χCR = 0.42 is shown as a solid red line. Small variations of χCR cause significant differences for the obtained slopes. (d) Torque during DNA supercoiling for the curves shown in b. (e) Torque after buckling as obtained from the simulations (filled circles) and after subtraction of 1.5 pN nm (open squares) together with the corresponding predictions from the theoretical model for χCR of 0.42 (solid lines). Torque values from simulations appear globally shifted by 1.5 pN nm compared to the theoretical model since subtraction of this value provides a much better agreement. Na+ concentrations and colors are as in c.

