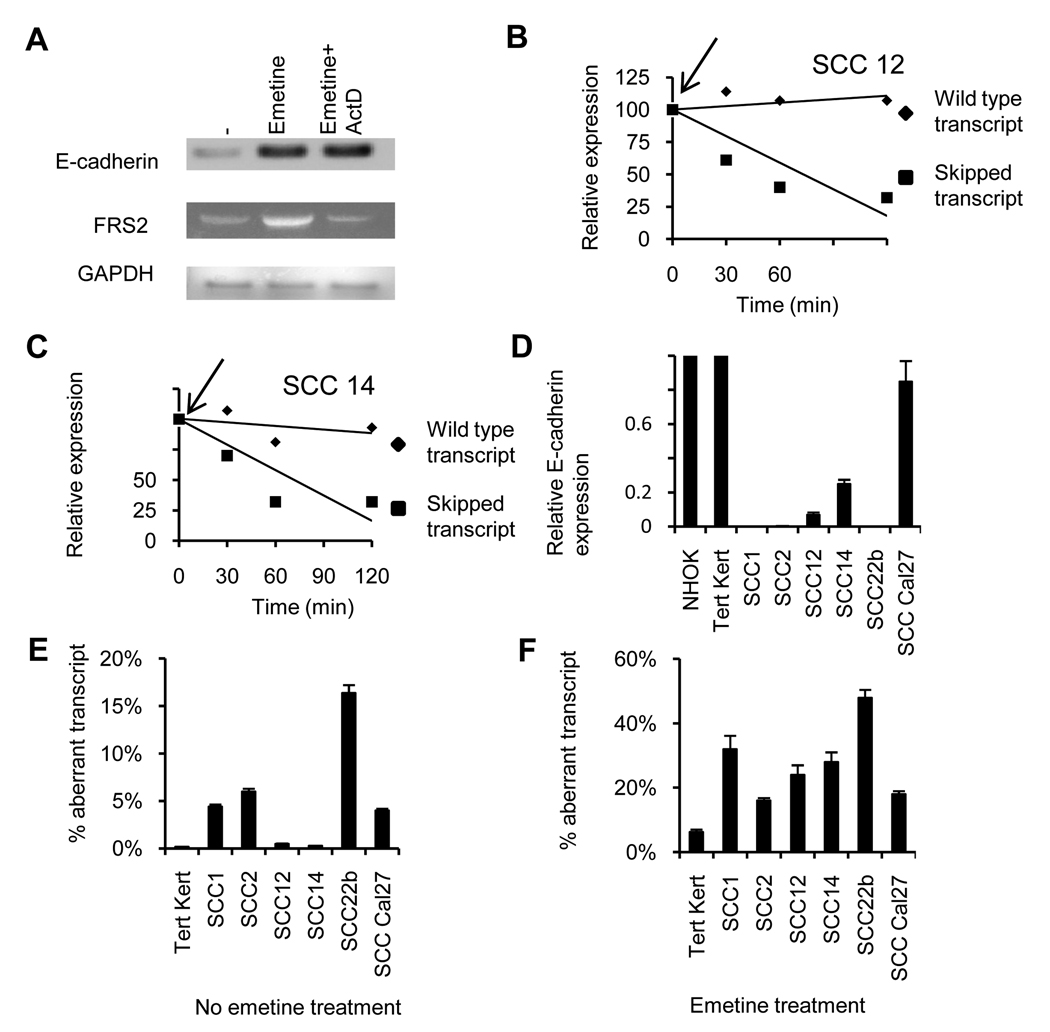
Figure 2. Analysis of the aberrant transcript.
A, RT-PCR analysis of untreated UMSCC12 cells treated with emetine or emetine plus actinomycin-D and analyzed for expression of E-cadherin RNA. With the same cDNA preparation FRS2 and GAPDH were amplified. B & C UMSCC14 and UMSCC12 cells were treated with actinomycin-D, and transcript specific PCR performed at different time-points. D, Relative expression of E-cadherin in Tert keratinocytes, NHOK and H&N cell lines relative to expression in Tert-kert cells. E, Percentage exon 11 skipped transcript calculated by the cycle difference between the two transcripts with transcript specific real time PCR of untreated (E) and emetine treated, (F) cells.

