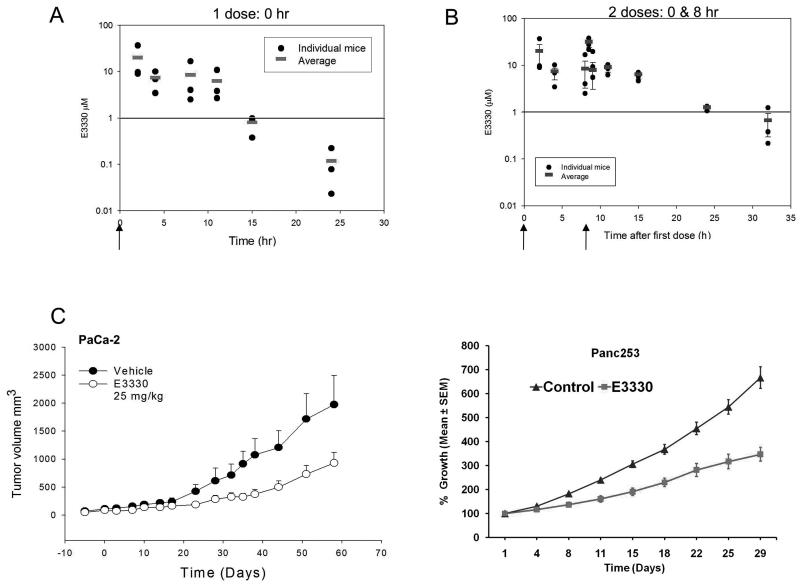
Figure 5.
E3330 pharmacokinetic profile and analysis of tumor growth rate in PaCa-2 and patient-derived xenografts. A, Serum concentrations of E3330 following one dose at 25 mg/kg, ip in 9% DMSO; B, Serum concentrations of E3330 (25 mg/kg, ip, 9% DMSO) following dosing at 0-h and 8-h as indicated by the arrows. C, Tumor growth delay following treatment with E3330 in PaCa-2 xenografts (left) and patient-derived tissue, Panc253 (right).

