
Figure 2.
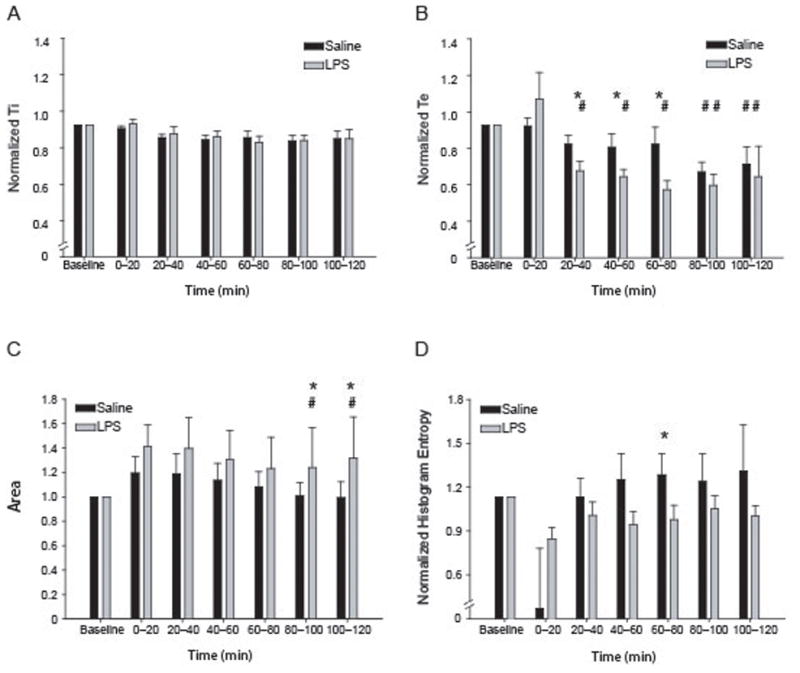
Injection of LPS into the trachea alters respiratory rhythm. (A–B) Summary data for LPS and control animals. (A) Ti shows no significant changes after LPS injection when compared to control. (B) LPS decreases the Te 20–80 minutes post injection (79.4 ± 4.2, 76.7 ± 3.3, 70.9 ± 4.1% of baseline) when compared to control (91.5 ± 4.0, 89.9 ± 6.2, 91.6 ± 7.7%). (C) Burst area is not significantly different in these preparations though the LPS-injected animals have a slightly larger burst area throughout the recording period. (D) LPS injection alters the normalized histogram entropy for interburst interval. LPS lowers the mean histogram entropy, with 60 – 80 min post-injection significantly lower than control. * indicates significant differences from control group (p<.05); # indicates significant difference across time (indicated over the control or IL-1β bars).