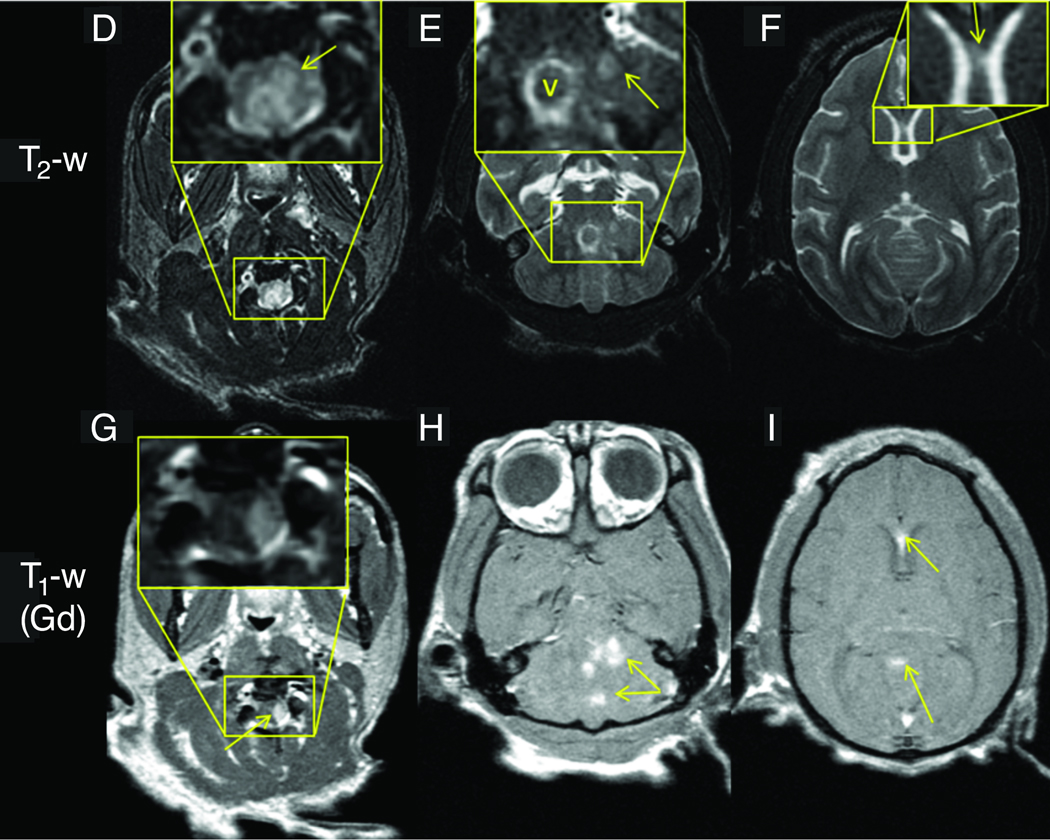
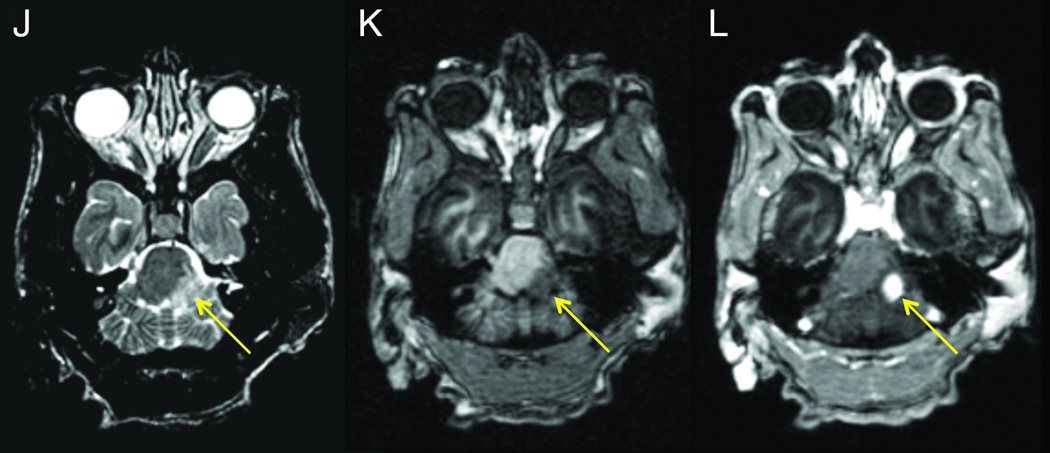
Figure 2. MRI of animals with JME.
Panels A–C, post-gadolinium T1-weighted MRI images from JM #19384 11 days after presentation with acute flaccid paralysis of the right pelvic limb. (A) Coronal image of cerebral hemispheres reveals gadolinium-enhanced lesions (arrows) in the internal capsule. (B) Coronal image of posterior cerebral hemispheres, cerebellum and brainstem shows 3 gadolinium-enhanced lesions in corpus medullare (arrows) of the cerebellum. (C) Sagittal image of upper cervical cord shows gadolinium-enhanced lesion (arrow). Panels D–I, axial 3Y MRI images from JM #26174 obtained 4 days after developing signs of JME. (D) Axial T2-weighed image of upper cervical spinal cord shows hyperintense signal that is expanded in insert and identified (arrow). (E) Hyperintense signal in cerebellar region that is expanded in insert and denoted (arrow). The hyperintense ring surrounding “v” in the insert is CSF fluid superior to the 4th ventricle adjacent to the superior medullary velum. (F) Hyperintense signal in the genu of the corpus callosum that is expanded in the insert and identified (arrow). Axial post-gadolinium T1-weighted image shows enhancing lesions in upper cervical spinal cord (G), cerebellum (H), and genu of the corpus callosum (I). Panels J–L, axial 3T MRI images from JM #13221 during the acute phase of JME. (J) Axial T2-weighted image shows hyperintense lesion in the left lateral pons and peduncule (arrow) that is hypointense on a T1-weighted pre-contrast MPRAGE (K, arrow) image. The lesion enhances on a T1-weighted MPRAGE image acquired 30 min after the administration of 0.2 mmol/kg gadoteridol (L, arrow.)


