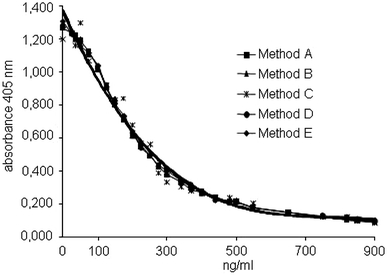
Fig. 2.

Correction of the OD concentration curves of methods A, C, D, and E by mathematical functions (see Table 1) to reduce the difference to method B (provisional standard method)

Correction of the OD concentration curves of methods A, C, D, and E by mathematical functions (see Table 1) to reduce the difference to method B (provisional standard method)