
Fig. 3.
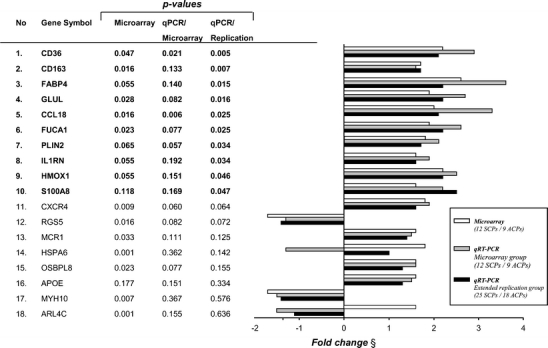
Confirmation of differential gene expression by qPCR. Genes are organized according to statistical significance (significant bolded). Microarray refers to non-adjusted p values from microarray analysis also given in Table 2 and Supplemental Table 3. QPCR/microarray refers to the real-time qPCR analysis results in the microarray group and qPCR/replication in the extended replication group. All p values from Mann–Whitney U test