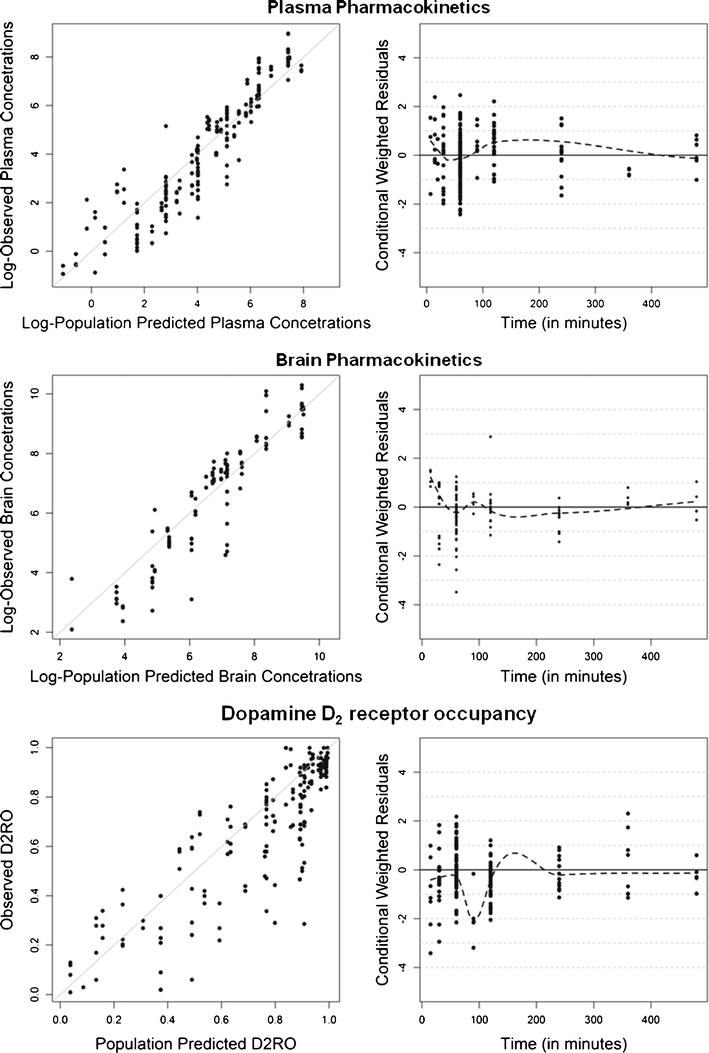
Fig. 2.

Goodness-of-fit plots for the final PBPKPD model. Depicted are scatter plots of the observed olanzapine concentrations or D2RO vs. population predictions and scatter plots of the population conditional weighted residuals vs. time.

Goodness-of-fit plots for the final PBPKPD model. Depicted are scatter plots of the observed olanzapine concentrations or D2RO vs. population predictions and scatter plots of the population conditional weighted residuals vs. time.