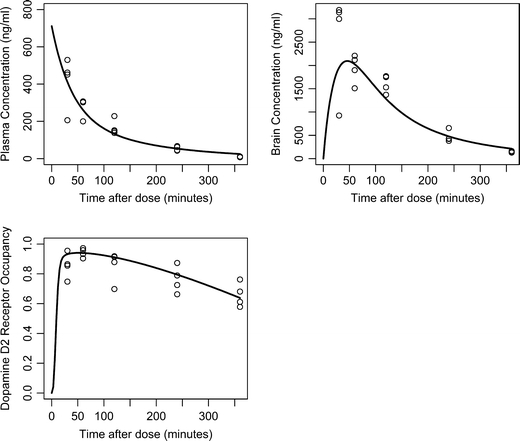
Fig. 3.

Observed and predicted olanzapine concentrations and D2RO vs. time. Open circles represent the observed olanzapine concentrations or D2RO; the solid line represent the population predictions for 3 mg/kg dose of olanzapine administered subcutaneously.
