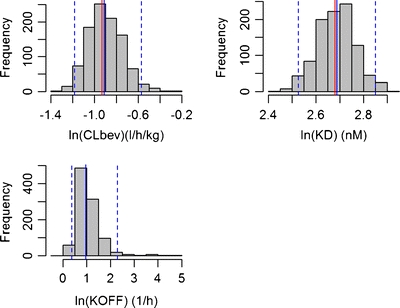
Fig. 6.

Histograms of CLbev, Kd, and koff (in logarithmic scale) based on the 1,000 stochastic simulations and estimations. Median values are plotted with blue solid lines and overlaid with the true parameter estimates (red solid lines). The blue dotted lines represent the 25th and 975th values of 1,000 parameter estimates.
