Fig. 7.

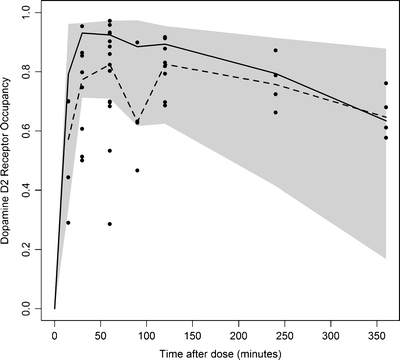
Predictive check of the PBPKPD model for D2RO after olanzapine administration, at 3 mg/kg dose. A number of 1,000 data sets were simulated from the final PBPKPD parameter estimates. Depicted are the observed D2RO (dots) and the shaded area represents the upper (95%) and lower (5%) quantile of the simulated D2RO. Median of the simulated D2RO are represented as solid line; median of the observed D2RO are represented as dashed line.
