
Fig. 8.
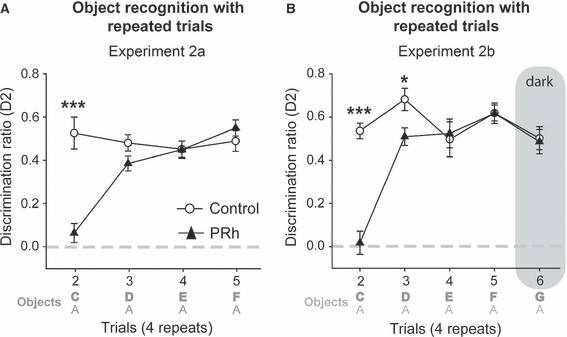
Experiment 2: performance of rats with perirhinal cortex lesions (PRh, black triangles) and their controls (Controls, white circle). (A) The left graph shows the trial by trial discrimination ratio (D2) when a series of novel objects is paired with the same, repeated familiar object for four trials (Experiment 2a). (B) Experiment 2b is a replication of Experiment 2a, except that an additional trial was given with recognition testing for that trial in the dark. Scores can range from −1 to +1. Data shown are mean ± standard error of the mean. Group differences *P< 0.05, ***P< 0.001. The dashed line is chance. In the schematic of the testing protocol (see Table 1) bold letters (upper) represent novel objects and lower letters represent familiar objects.