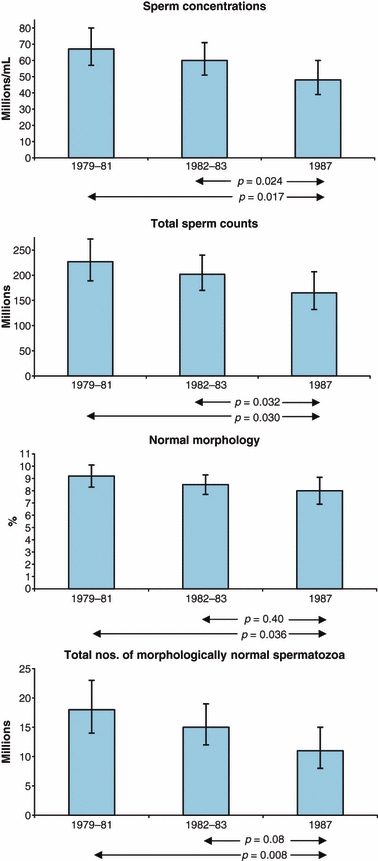
Figure 1.

Sperm concentrations, total sperm counts and morphology according to year of birth of men representative of the general young Finnish population. The figures represent medians adjusted for confounders and 95% confidence intervals. The most recently born men had significantly lower levels than the earliest born men.
