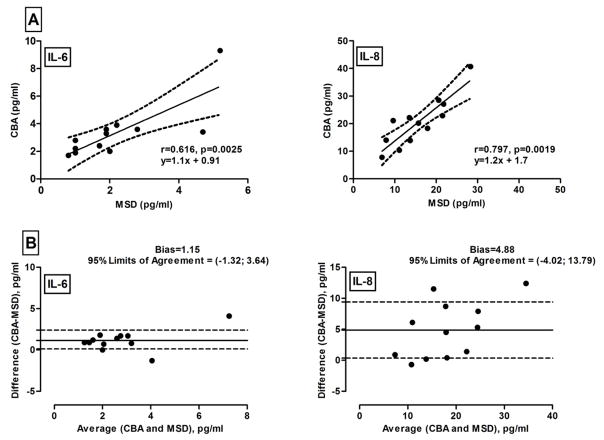
Figure 3. Relationships between concentrations of IL-6 and IL-8 measured by MSD and CBA.
Cytokines were measured in twelve samples. Data pairs were cross-compared using the Spearman correlation test (panel A) and Bland-Altman plot (panel B). Solid lines are the regression line (A) and the mean bias (B) between MSD and CBA-derived concentrations. Dashed lines represent the confidence bands (A) and one standard deviation above and below the mean bias (B).

